Spectrogram Lab
2026 · Rust · WebAssembly · Web Audio · How this site works
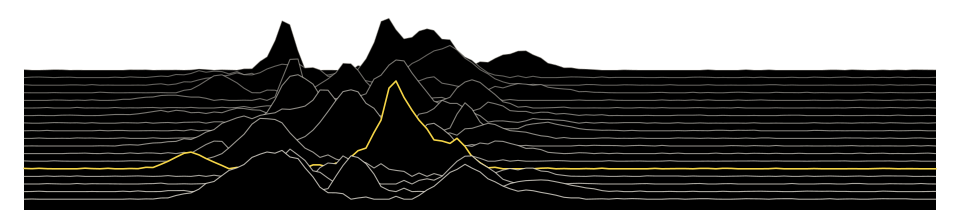
A spectrogram draws a sound: time runs across, pitch runs up, and the brighter a point, the louder that pitch is at that moment. Read it backwards and any picture is a sound. On the Windowlicker single in 1999, Aphex Twin ended the track whose title is a formula, usually called "Equation", with his own face, which you only meet if you look at the music instead of listening to it. The Spectrogram Lab does both directions. Paint, stamp words or drop a picture and press play; drop a sound, or record one, and see it. heard shows the spectrogram of what's actually playing, which is where the picture comes back.
Playing a picture
Each of the picture's 256 rows is a sine wave at its row's pitch, 80 Hz at the bottom and 10 kHz at the top to begin with, and the brightness along the row is how loud it plays, moment to moment, sliding smoothly from one column to the next. Add them all up and you have the sound. It's additive synthesis, what MetaSynth and later Coagula made easy for musicians, and it explains how drawings sound: a thin line is one sine, a pure tone, gliding if the line slopes; a thick blob is many sines at once, so it rushes like noise; and black is silence, not just quiet, because only the top 60 decibels of brightness count.
Two choices shape it. The pitch can go up the picture in octaves, every octave as tall as the next, the way music hears, or in hertz, every thousand cycles as tall as the next, the way most spectrograms draw it. And every oscillator starts at a random point in its cycle: start them all together and a block of pixels plays as a single click at the start of each column.
Drawing a sound
The other way round is a Fourier transform: take a slice of the sound, find how much of each frequency is in it, and do that once per column. The catch is that a slice can't be sharp in both time and pitch. A long one tells two low notes apart but smears when they happen; a short one is precise in time but can't separate pitches closer than its bins. A low note needs a long look, a high one doesn't, so each column here is taken three times, through windows of 8192, 4096 and 2048 samples, and each row reads the shortest window that can still tell it from its neighbours. It's close to how a constant-Q transform works, and it's why the small print in the hello sample sits up high: up there the rows are wide enough to read back.
The face sample is my yellow avatar, fitted into the middle of the picture with its edges faded to silence: its yellow background is loud, a wash of noise, and the figure is the quiet carved out of it. Play it with heard on and the face comes back from the sound, sharpest at the top, where the rows are widest.
How it's built
The engine is a Rust crate with no dependencies, compiled to a 40 KB WebAssembly module with no bindings, like the other labs': a picture goes into one buffer, play fills another with sound, draw turns sound back into a picture, and its FFT is thirty-odd lines of the textbook radix-2 kind. Playing turns each oscillator by multiplying it by a fixed complex number every sample rather than calling a sine, so a drawing plays in a few milliseconds and a busy photograph in under half a second. Drawing a sound takes a tenth of a second or so. Nothing you drop or record leaves the browser.
A link holds the picture at sixteen shades a pixel, deflated, with how it plays: a drawing comes to a kilobyte or two. A photograph doesn't fit, so its link keeps only the settings, and the PNG is the way to share it.
Back to Labs · write a tune in the Chiptune Lab · make an intro in the Intro Lab · see how this site works.